What is the RSI Indicator and How Can it Help Your Trading?
Aug 15
Have you ever wished you had a simple way to see if a stock or other asset was about to go up or down? Well, there's a tool that many traders use to help them do just that. It's called the Relative Strength Index, or RSI for short.
The Relative Strength Index (RSI) is one of the most useful tools traders use to read market momentum. It helps you understand whether a currency pair, stock, or other asset might be overbought or oversold, so you can make smarter choices. In simple words, it helps you avoid chasing high prices or getting stuck in falling markets.
What Exactly is the RSI?
Imagine a speedometer for a car. It tells you how fast the car is going. The RSI is kind of like a speedometer for the price of something you're trading, like a stock or a currency. But instead of speed, it measures how quickly the price is changing and if it might be getting ready to change direction.
RSI stands for Relative Strength Index. It sounds technical, but the idea is simple: it shows you how strong recent price moves are, whether the market has been going up or down too quickly.
The RSI is shown as a line on a scale from 0 to 100. This number tells you whether a market may be overbought or oversold.
Reading the RSI: The Key Numbers
When you look at an RSI chart, you'll usually see two important lines:
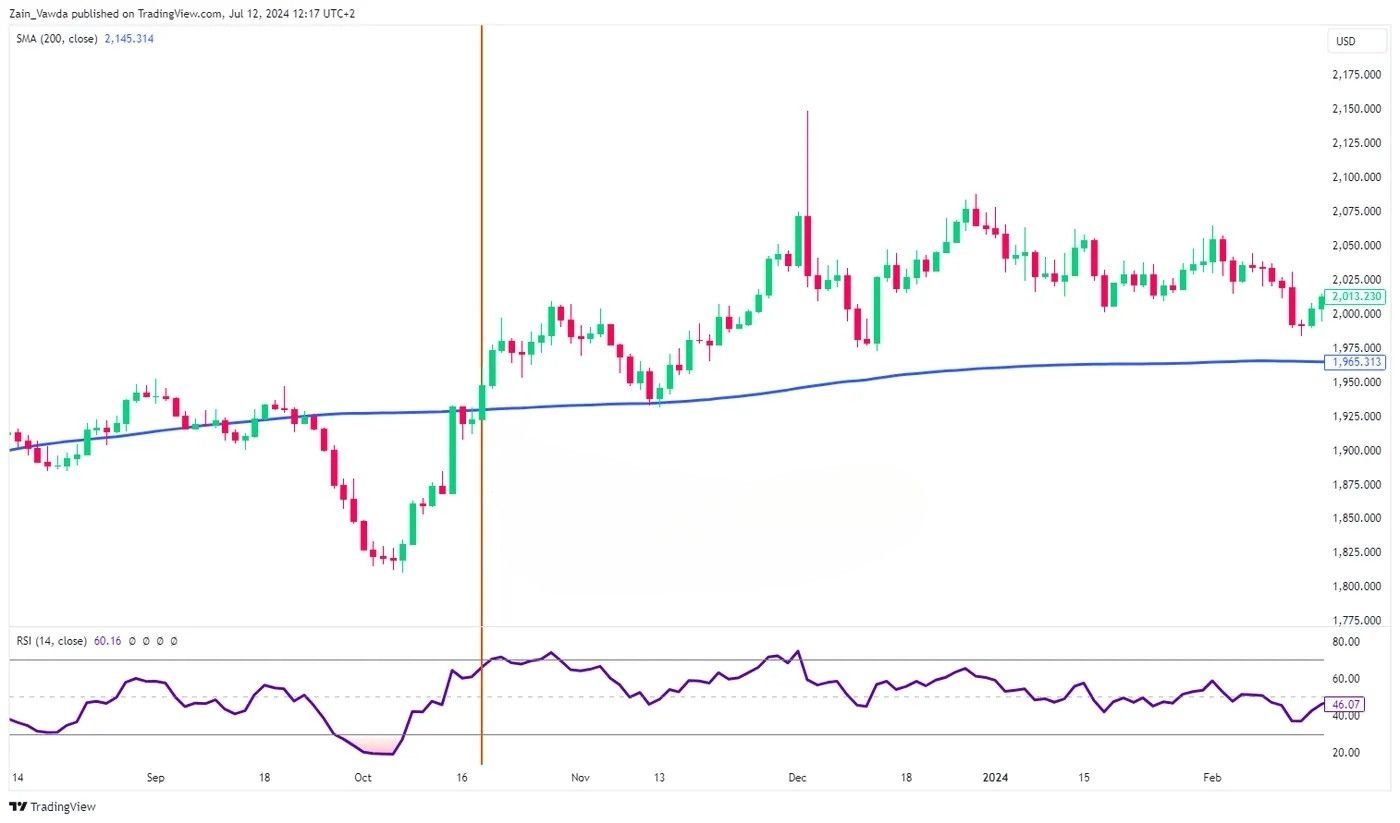
The 70 Line: If the RSI goes above 70, it often means that the price has gone up a lot recently and might be "overbought." Think of it like a stretched rubber band – it can only stretch so far before it snaps back. So, when the RSI is above 70, the price might be due for a fall.
The 30 Line: If the RSI drops below 30, it often means that the price has gone down a lot recently and might be "oversold." The rubber band has been stretched the other way and might be ready to bounce back up. So, when the RSI is below 30, the price might be due for a rise.
It's important to remember that just because the RSI goes above 70 doesn't mean the price will definitely fall right away, and the same goes for when it drops below 30. These are just potential signals, not guarantees.
Simple Ways to Use the RSI for Trading
Start simple with these approaches. They build a foundation before advancing.Normal text.
Overbought and Oversold Trades
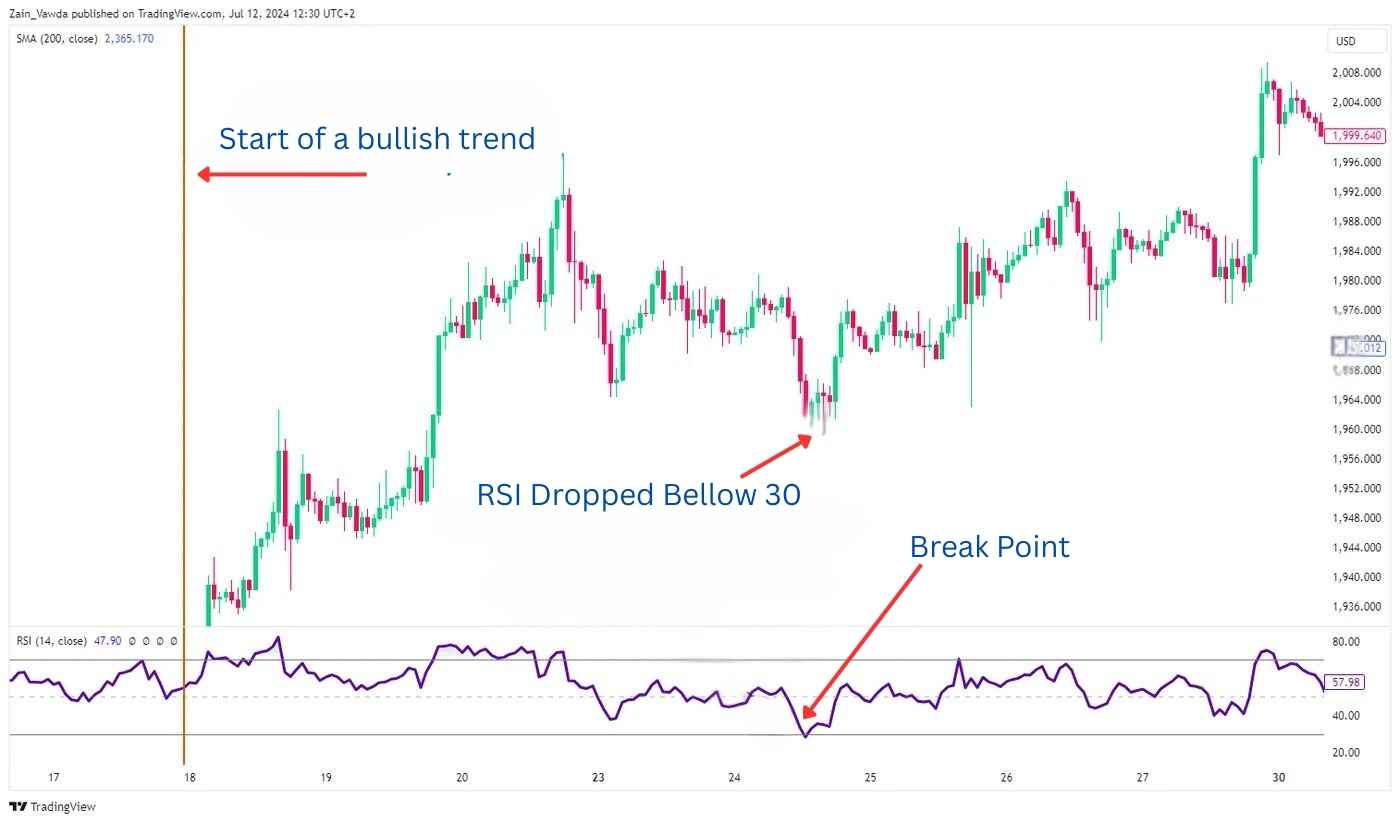
Buy when RSI crosses above 30 from below, it's an oversold signal hinting at a bounce. Sell when it dips below 70 from above, signaling overbought.
On a 1-hour EUR/USD chart, wait for RSI under 30, then buy if price holds support. Set a stop below the low and target the next resistance. This works in ranges but watch trends, it can fail if momentum persists.
Risk 1% per trade. Aim for a 1:2 reward ratio.
Centerline Crossover Strategy
RSI crossing 50 can confirm trends. Above 50 supports buys in uptrends; below favors sells in downtrends.
For GBP/JPY, if price trends up and RSI crosses above 50, add to longs. This filters weak signals, boosting win rates.
Use it with moving averages for confirmation. It's great for beginners spotting trend strength.
These basics keep things easy, focusing on clear entries.
Taking it a Step Further: RSI Divergence
Once you're comfortable with the basics, you can look for something called divergence. This happens when the price of something is doing one thing, but the RSI is doing something different. Divergence can be a stronger signal that the trend might be about to change.
Bullish Divergence (Time to Buy?)
Imagine the price of a stock makes a new low, but at the same time, the RSI makes a higher low than before. This is called bullish divergence. It can be a sign that even though the price hit a new low, the selling pressure might be weakening, and the price could be about to go up.
Image Source: TRADINGVIEW.COM
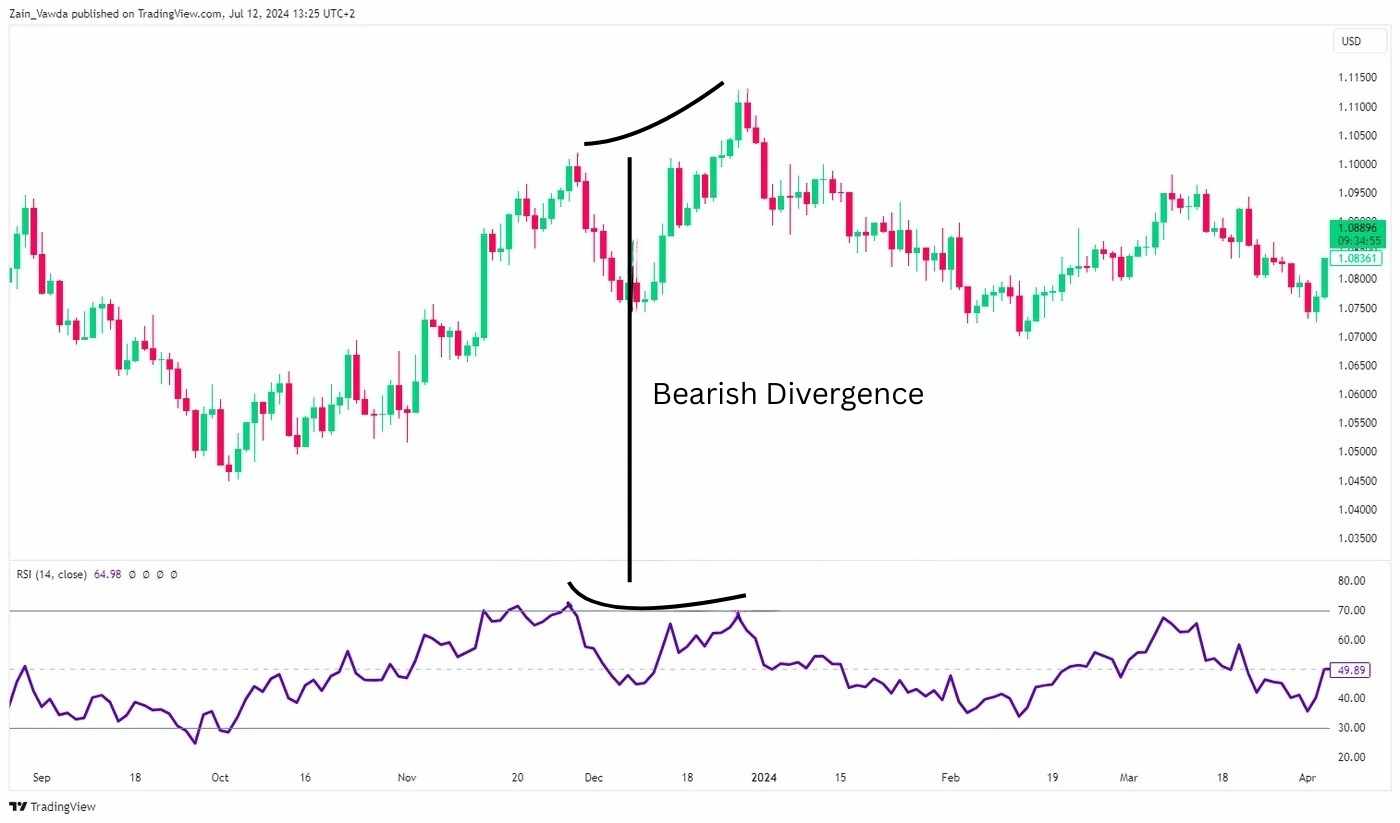
Bearish Divergence (Time to Sell?)
Now imagine the price of a stock makes a new high, but the RSI makes a lower high than before. This is called bearish divergence. It can suggest that even though the price reached a new high, the buying pressure might be losing steam, and the price could be about to go down.
Divergence isn't always a perfect signal, but it can be a helpful clue.
Combining the RSI with Other Tools
Experienced traders often use the RSI along with other trading tools to get a clearer picture of what might happen next. Think of it like using more than one sense to understand something better.
Moving Averages: These smooth out the price action and can help you see the overall trend more easily. If the price is above a moving average and the RSI gives a buy signal, that could be a stronger sign than just the RSI alone.
Support and Resistance Levels: These are price levels where the price has often bounced back from in the past. If the RSI gives a sell signal near a resistance level, it could be a more reliable signal.
Important Things to Remember About the RSI in 2025
Even though the RSI is a useful tool, it's not perfect. Here are some key things to keep in mind:
Don't Rely on It Alone: The RSI should usually be used with other analysis techniques to confirm potential trading signals. Don't make trades based only on what the RSI is telling you.
Settings Can Be Adjusted: The most common setting for the RSI is 14 periods (which could be 14 days, 14 hours, etc.). However, some traders adjust this. For faster trading, they might use a shorter period like 9. For longer-term trading, they might use a longer period like 21.
Manage Your Risk: No trading strategy wins all the time. Always use stop-loss orders to limit your potential losses and never risk more money than you can afford to lose on a single trade.
Key Takeaways
RSI measures momentum on a 0-100 scale, spotting overbought (above 70) and oversold (below 30) conditions.
Use default 14-period setting, but tweak for your timeframe, shorter for day trading, longer for swings.
Basic strategies like overbought/oversold and centerline crossovers suit beginners.
Advanced ones, including divergence and swing rejections, catch reversals and continuations.
Combine RSI with tools like moving averages or MACD for better confirmation.
Always manage risk and test ideas to avoid common pitfalls like ignoring trends.
Final Thoughts
The RSI indicator is one of the simplest and most effective tools in a trader’s toolbox. It shows when a market might be too high or too low, helps you spot trends, and can even signal reversals.
But remember, RSI is not magic. It works best when combined with smart planning, proper settings, and good risk management.
If you take the time to understand it, test it, and use it with discipline, RSI can become your edge in the markets.
Our motto is
#Read | #Watch | #Learn | #Improve
Join LITFX Academy and master the skills that matter
From beginner to pro, we help you understand Forex trading the smart way. Learn the tools, grow your confidence, and trade like a pro from day one.
Limited-time Black Friday offer is now available!
Created with
Login or sign up to start learningLogin to start learning